
The Distribution Manifesto
Chapter 5 of 11 · 15 min read
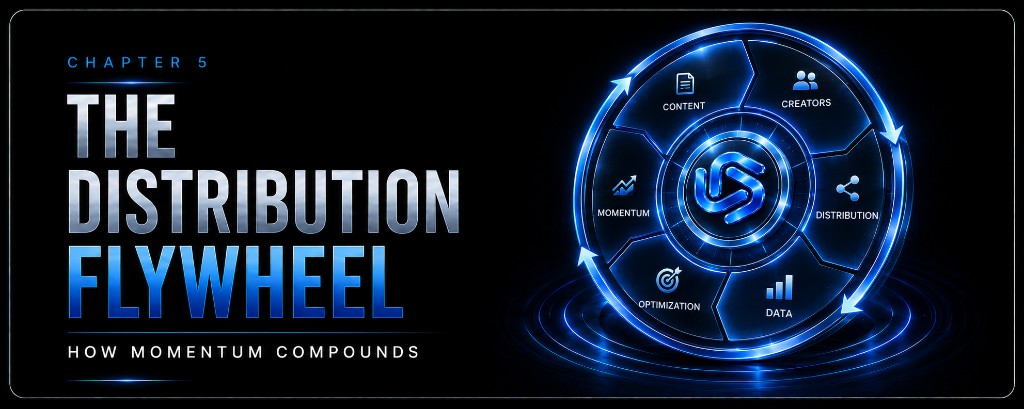
The Distribution Flywheel
How to Stop Starting From Zero
The argument
Creator-Powered Distribution becomes infrastructure when the system compounds.
A single clip can generate attention. A single creator can produce reach. A single campaign can create a temporary spike. None of those outcomes, by themselves, prove that a company has built distribution infrastructure.
The test is whether every cycle makes the next cycle stronger.
The Distribution Flywheel is the compounding loop created when source content, clip selection, creator distribution, performance data, optimization, and capital allocation reinforce one another. It turns distribution from an episodic marketing activity into a repeatable operating system.
This chapter explains how that flywheel works, how to measure it, where it breaks, and how to engineer resilience into the system.
Why Momentum Matters More Than Reach
Reach is an output.
Momentum is a system state.
This distinction matters because the creator-powered model can create misleading signals. A campaign can generate a large number of views while the underlying system becomes weaker. It can produce a viral clip while creator trust deteriorates. It can generate a low creator-powered CPM while the operator learns nothing useful. It can flood platforms with assets while quality, compliance, and message discipline collapse.
Those are not flywheels. They are temporary spikes.
A true distribution flywheel has three properties:
- Repeatability: the system can produce useful distribution again without rebuilding from zero.
- Learning accumulation: each cycle improves source selection, packaging, creator matching, incentives, governance, or capital allocation.
- Capacity expansion: the system increases durable distribution capacity through retained creators, reusable assets, better workflows, better performance history, and stronger operating confidence.
The operator’s job is not to chase reach in isolation. The operator’s job is to build a system where attention, learning, creator supply, and capital allocation reinforce one another.
That is what makes the flywheel strategic.
Legacy marketing often treats distribution as a sequence of disconnected campaigns:
- Launch a campaign.
- Publish assets.
- Measure results.
- Report performance.
- Move on.
Creator-Powered Distribution should be operated differently:
- Select source content.
- Convert it into a portfolio of distribution tests.
- Route those tests through creator surfaces.
- Capture performance data.
- Identify winning hooks, creators, angles, formats, audiences, and surfaces.
- Reallocate capital and creator access toward the winners.
- Use the learning to improve the next source asset, brief, incentive structure, and campaign design.
The second model compounds. The first model resets.
The flywheel is the difference.
The day I corrected my own revenue story
In July 2026, after Clipur had generated more than $100,000 in 30 days, I described the pace as roughly a million dollars in annual recurring revenue.
Then I stopped and corrected myself.
It was not ARR. The revenue was real, but it was not recurring.
That correction contains the entire lesson of this chapter. Multiplying one strong month by twelve does not create a flywheel. At another point in the same stretch of the company, our churn had effectively reached 100%. We were good at closing, collecting payment, and creating activity. The weak point was the handoff after the sale. Clients could go quiet between payment and delivery, and every silent handoff spent trust we would later have to earn back.
I had confused velocity with momentum.
Velocity is how fast something is moving now. Momentum is what makes it easier to keep moving. Revenue can spike without recurring. Views can spike without learning. Creator participation can spike while the best creators leave. A campaign can look active while the underlying system gets weaker.
This is the operator's test:
If the current campaign ended today, what would make the next campaign easier, better, or more profitable?
If the answer is nothing, you have a spike. If the answer includes retained clients, trusted creators, reusable assets, cleaner data, faster handoffs, sharper briefs, and better allocation decisions, you are building a flywheel.
The same mistake appeared in the product.
In a February product review, our internal admin view could see aggregate campaign spend and impressions. The client could see individual campaign details but not the same account-level truth. I remember hearing the gap described and saying, in effect, “That seems like a big deal.”
It was.
The work could be happening exactly as planned while the client experienced uncertainty. If the buyer has to ask who owns the account, whether the campaign is live, how much budget remains, what has been approved, or when the next update is coming, the product is spending trust even when delivery is moving.
Months later, after churn forced the issue, we documented the client journey as ten explicit stages: closed-won, handoff, kickoff, first activation, active delivery, early-signal review, steady-state management, business review, and a decision to renew, expand, reduce, pause, or exit. Each stage needed a named owner, a due date, an exit condition, and a client-facing next step.
That was not customer-service decoration around the product. It was part of the product.
For a business owner buying distribution, the dashboard should answer what happened. The operating relationship should answer what happens next.
The Distribution Flywheel
The Distribution Flywheel is the compounding loop created when content output, creator participation, performance data, optimization, and capital allocation reinforce each other.
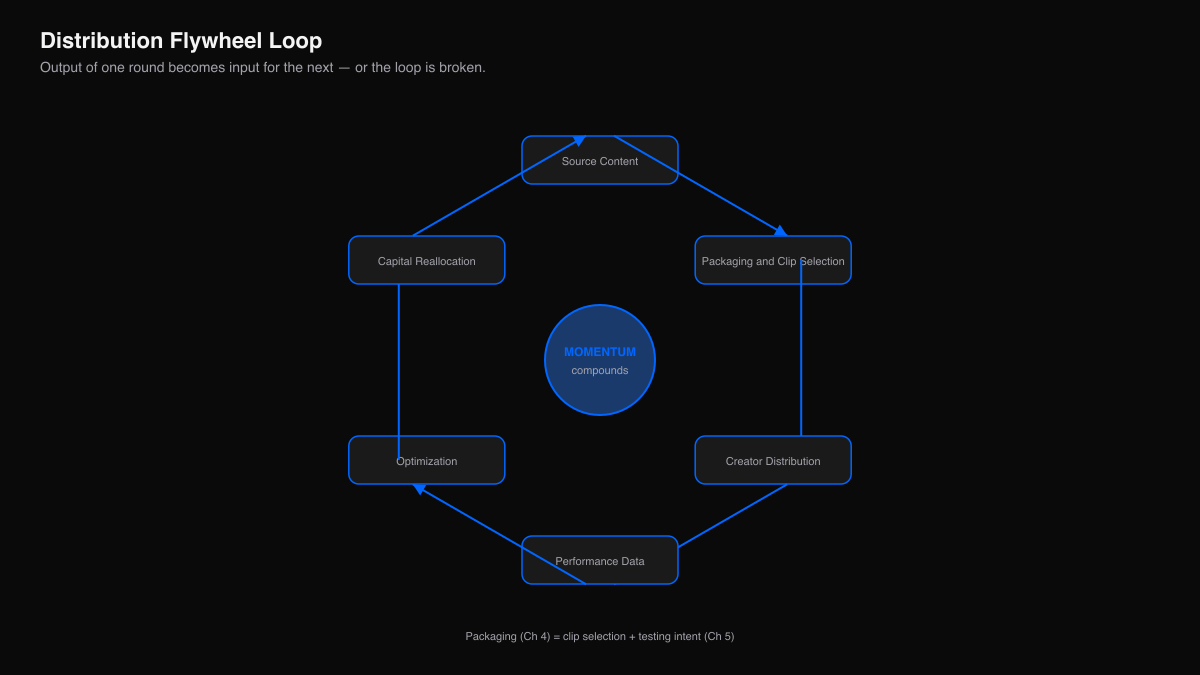
The core loop is:
- Source Content: long-form, short-form, live, recorded, written, founder-led, customer-led, educational, entertainment, or proof-based material enters the system.
- Clip Selection and Packaging: operators or creators identify moments, hooks, angles, formats, and platform-native packages.
- Creator Distribution: creators publish, remix, contextualize, or distribute assets across relevant surfaces.
- Performance Data: the system captures signals about hooks, creators, audiences, platforms, retention, engagement, quality, and outcomes.
- Optimization: operators translate data into creative, operational, and incentive changes.
- Capital and Creator Reallocation: budget, access, creator slots, brief priority, amplification, and source-content effort move toward what is working.
- Stronger Next Cycle: the next distribution cycle begins with better inputs, better creators, better briefs, better packaging, better governance, and stronger confidence.
A campaign becomes a flywheel only when the output of one cycle becomes input quality for the next cycle.
The flywheel should be understood as an operating system, not a diagram.
A diagram can show the loop. The operating system makes the loop real.
The Core Loop as an Operating System
The Distribution Flywheel has six operating nodes.
| Node | Primary Function | Core Question | Main Output |
|---|---|---|---|
| 1. Source Content | Provides raw material for distribution. | What are we distributing from? | Source inventory. |
| 2. Clip Selection and Packaging | Converts raw material into market tests. | What angles should the market see? | Clip portfolio and variant set. |
| 3. Creator Distribution | Routes assets through trusted surfaces. | Who should carry the message? | Published creator output. |
| 4. Performance Data | Converts attention into learning. | What did the market tell us? | Tagged performance signals. |
| 5. Optimization | Converts learning into operating changes. | What should change next cycle? | New briefs, variants, creator decisions, and workflow changes. |
| 6. Capital and Creator Reallocation | Moves resources toward winners. | Where should we concentrate effort? | Updated budget, incentives, creator access, and source-content priorities. |
The flywheel does not require every node to be perfect. It does require every node to exist.
A company can run an experimental pilot with imperfect measurement. It can run a small campaign with manual approvals. It can operate early creator recruitment with a simple spreadsheet. But if any node is permanently missing, the system cannot compound.
The most common error is building only the visible side of the flywheel: source content, clips, and creator posts.
The invisible side is what compounds: tagging, analysis, optimization, reallocation, creator retention, payout trust, rights management, and governance.
The visible side creates attention.
The invisible side creates infrastructure.
Node 4: Performance Data
Performance data is the conversion layer between attention and learning.
Without data, the flywheel becomes a content treadmill. The system produces output but cannot reliably explain what worked, why it worked, or what should happen next.
The data layer should answer seven questions:
- Which source assets produced the strongest distribution?
- Which clips, hooks, and formats created qualified attention?
- Which creators produced relevant attention, not just raw views?
- Which platforms and surfaces showed the best fit?
- Which audience pockets responded with trust, retention, comments, saves, shares, or conversion proxies?
- Which operating constraints slowed the system?
- Which decisions should change in the next cycle?
A creator-powered distribution system does not need perfect attribution to be useful. It does need consistent tagging and comparable measurement.
Minimum Viable Flywheel Data Schema
A minimum viable schema should tag every asset by:
| Field | Purpose |
|---|---|
| Source Asset ID | Connects derivatives back to original material. |
| Clip ID | Identifies the specific derivative asset. |
| Hook Type | Enables pattern analysis across openings. |
| Angle | Tracks narrative, proof, tactical, contrarian, product, or identity frame. |
| Creator ID | Measures creator-level performance and retention. |
| Creator Cohort | Groups creators by vertical, audience, platform, or quality tier. |
| Platform | Separates surface behavior. |
| Format | Tracks native format type. |
| Publish Date | Enables velocity and decay measurement. |
| Approval Date | Reveals workflow latency. |
| Incentive Type | Connects payout model to behavior. |
| Rights Status | Confirms reuse and amplification permissions. |
| Qualified Attention Metric | Separates useful attention from raw reach. |
| Business Outcome Proxy | Connects distribution to pipeline, leads, signups, search lift, community growth, or sales-assisted usage. |
This schema should evolve over time, but the early principle is clear: if the system cannot compare assets, creators, hooks, and surfaces, it cannot compound learning.
Vanity Metrics vs. Operating Metrics
Views matter, but views alone are insufficient.
A flywheel should distinguish between vanity metrics and operating metrics.
| Vanity-Prone Metric | Operating Version |
|---|---|
| Total views | Qualified attention by audience, creator, and surface. |
| Total clips | Approved and published assets per source asset. |
| Total creators | Active, retained, high-fit creators by cohort. |
| Average performance | Median, P75, P90, variance, and repeat winners. |
| Engagement rate | Engagement quality by intent, sentiment, and relevance. |
| Low CPM | Creator-powered CPM adjusted for quality and reuse. |
| Campaign report | Decision log and reallocation actions. |
The report is not the endpoint.
The decision is the endpoint.
If data does not change creator selection, packaging, source content, incentives, governance, or budget, it has not entered the flywheel.
It is only reporting.
Node 5: Optimization
Optimization converts performance data into operating changes.
This is where many distribution systems fail. They collect data, produce a report, and then continue operating the same way.
That is not optimization.
Optimization requires a change in the system.
Examples:
- Move budget toward a creator cohort that produced lower creator-powered CPM and higher trust-adjusted attention.
- Produce more clips from a source type that extends content half-life.
- Change the opening frame because retention is weak in the first second.
- Create additional proof-based variants because proof clips drive higher qualified engagement.
- Remove creators with high output but low compliance accuracy.
- Increase incentives for creators who produce high-performing, reusable assets.
- Reduce approval latency by pre-approving claim language and visual rules.
- Expand a winning hook to new platforms.
- Retire a format that attracts unqualified attention.
- Adjust future source content around the angles creators and audiences respond to.
Optimization should be explicit. The team should be able to show the decision record:
| Observation | Interpretation | Decision | Owner | Time Window |
|---|---|---|---|---|
| Tactical clips outperformed founder monologues on qualified saves. | Audience wants usable breakdowns, not broad thought leadership. | Source next two recordings as tactical teardown content. | Content lead | Next production cycle. |
| Creator cohort B had lower views but higher conversion proxy. | Smaller creators may have higher audience fit. | Increase cohort B allocation by 25% for next test. | Campaign operator | Next campaign week. |
| Rejection rate high because claim language unclear. | Brief lacks approved proof statements. | Add approved claims library. | Brand/governance owner | Before next approval batch. |
Optimization is not a feeling. It is a change log.
The Learning Loop
The learning loop has five steps:
- Observe: collect performance and operational signals.
- Interpret: identify plausible causes, not just outcomes.
- Decide: choose what will change.
- Execute: apply the change to creators, content, workflow, incentives, or budget.
- Validate: measure whether the change improved the next cycle.
A learning loop is only complete after validation.
A common mistake is stopping after interpretation. Teams say, “This worked,” but do not define what they will do differently. Or they define a change but never test whether it improved the system.
The flywheel requires closed-loop learning.
Optimization Metrics
- Number of validated insights per campaign cycle.
- Percentage of insights that trigger an operating change.
- Time from insight to change.
- Winning format repeat rate.
- Performance lift from repeated winning formats.
- Improvement in approval rate after brief changes.
- Improvement in creator retention after incentive changes.
- Improvement in qualified attention after creator cohort reallocation.
- Number of source-content decisions influenced by prior distribution data.
Optimization is where distribution becomes intelligence.
Node 6: Capital and Creator Reallocation
Reallocation is the force that makes momentum compound.
A system that identifies winners but does not shift resources is not a flywheel. It is an analytics dashboard.
Reallocation can happen across several resource types:
| Resource | Reallocation Example |
|---|---|
| Budget | Increase payout pool for high-performing creators or formats. |
| Creator Access | Invite more creators from a winning cohort. |
| Source Content | Produce more raw material in the format that travels. |
| Brief Priority | Emphasize proof clips instead of generic awareness clips. |
| Paid Amplification | Put spend behind creator assets with strong organic signal and rights clearance. |
| Internal Attention | Move operator time away from weak surfaces toward active learning zones. |
| Governance Effort | Pre-approve repeated winning claims to reduce approval latency. |
| Platform Focus | Expand or reduce activity based on qualified attention and creator fit. |
Reallocation is often where large organizations lose the flywheel. They can gather data, but budget cycles, brand approvals, legal review, channel silos, agency contracts, and executive reporting rhythms slow the response.
Creator-powered distribution operates in faster market windows. A winning hook may have its highest leverage within days. A creator cohort may need immediate reinforcement. A platform trend may decay before the next formal meeting.
The system needs predefined reallocation authority.
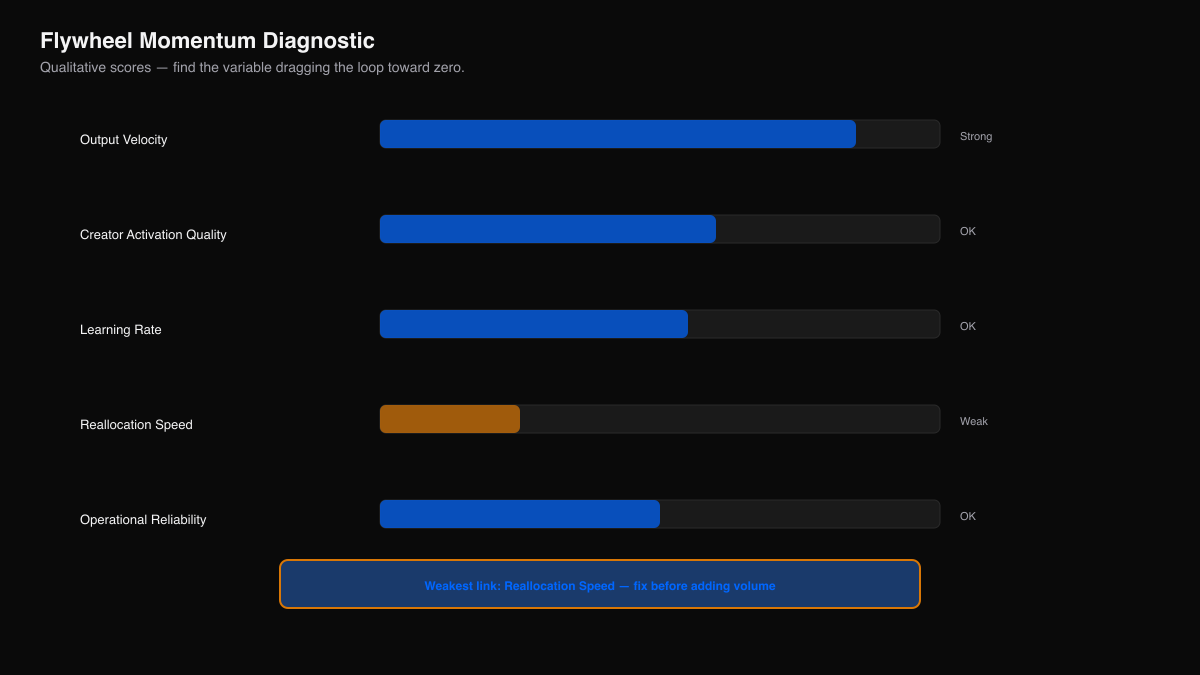
Reallocation Speed
Reallocation Speed is the time required to move budget, incentives, creator focus, brief direction, amplification, or source-content priority toward validated winners.
A simple measure:
Reallocation Speed = Time from Validated Signal to Resource Shift
Lower time is generally better, but not at the expense of governance or accuracy. The objective is disciplined speed, not impulsive spending.
Reallocation can be tiered:
| Decision Type | Example | Authority Needed |
|---|---|---|
| Micro Reallocation | Shift variants, hooks, or captions. | Campaign operator. |
| Creator Reallocation | Give more assignments to a winning creator cohort. | Creator manager or campaign lead. |
| Budget Reallocation | Increase payout pool, paid amplification, or bonus structure. | Budget owner. |
| Source Reallocation | Change content production calendar. | Content or executive owner. |
| Strategic Reallocation | Enter a new creator niche, platform, or distribution mechanism. | Executive owner. |
The more decisions that require executive escalation, the slower the flywheel.
Executives should define boundaries. Operators should make bounded decisions inside those boundaries.
Reallocation Failure Modes
| Failure Mode | Symptom | Fix |
|---|---|---|
| Budget Rigidity | Winners cannot receive more capital. | Create a reserved reallocation pool. |
| Incentive Rigidity | Strong creators are paid like weak creators. | Add performance tiers or bonuses. |
| Approval Rigidity | Winning variants wait too long. | Pre-approve repeated claim and format patterns. |
| Channel Politics | Budget stays in owned or paid channels despite creator evidence. | Define cross-channel distribution scorecards. |
| Data Skepticism | Team refuses to act because attribution is imperfect. | Use decision-grade evidence, not perfection. |
| No Owner | Everyone sees the insight, no one moves resources. | Assign a reallocation owner before launch. |
Reallocation is the executive muscle of the flywheel.
Without it, momentum leaks.
Flywheel Breakage Points
Every flywheel has breakage points.
A breakage point is a place where the loop stops transferring energy from one stage to the next. The campaign may still produce visible activity, but the compounding mechanism weakens.
Breakage Point Map
| Breakage Point | Where It Occurs | Symptom | Primary Fix |
|---|---|---|---|
| Source Starvation | Before clip selection | Creators lack usable material. | Build rolling source inventory. |
| Low Content Liquidity | Source to clip selection | Content cannot be converted into native variants. | Improve source structure and atomization workflow. |
| Packaging Bottleneck | Clip selection | Good ideas move slowly or in poor formats. | Standardize clip portfolios and platform templates. |
| Creator Mismatch | Creator distribution | Output reaches the wrong audience. | Improve creator vetting and cohort mapping. |
| Incentive Drag | Creator distribution | Creators participate weakly or churn. | Adjust payout, bonus, recognition, and brief clarity. |
| Approval Latency | Workflow | Assets decay before approval. | Pre-approve claims, create guardrails, assign approval SLAs. |
| Measurement Fog | Performance data | Team cannot compare assets, creators, or surfaces. | Implement minimum viable tagging schema. |
| Optimization Theater | Optimization | Reports are produced but behavior does not change. | Require decision logs and validation cycles. |
| Reallocation Paralysis | Capital allocation | Winners do not receive more resources. | Predefine reallocation authority and reserve budget. |
| Creator Trust Erosion | Creator relationship | High-performing creators stop participating. | Improve payout reliability, feedback, incentives, and communication. |
| Platform Overconcentration | Distribution surface | Results depend on one algorithm or surface. | Diversify creators, formats, and platforms. |
| Governance Failure | Compliance | Scale creates brand, legal, or rights risk. | Build rights, claims, and review controls before scaling. |
The operator should inspect breakage points in sequence.
Do not assume the visible failure is the root failure. Low views may look like a creator problem, but the root cause may be weak source content. Slow output may look like creator laziness, but the root cause may be approval latency. Low trust may look like an audience issue, but the root cause may be thin proof density.
A flywheel diagnostic should trace the loop from input to reallocation.
Breakage Diagnosis Questions
Ask these in order:
- Do we have enough distribution-grade source content?
- Can the source content be converted into multiple native variants?
- Are creators clear on the message, constraints, and incentives?
- Are creators relevant to the audience segment?
- Is output moving fast enough to generate market signal?
- Are approvals fast enough to preserve attention windows?
- Are claims, rights, and brand-safety controls clear?
- Can we compare performance across source, clip, hook, creator, platform, and cohort?
- Did the data create a decision?
- Did the decision create a resource shift?
- Did the next cycle improve?
If the answer to question 10 is no, the flywheel has not completed a full loop.
Operating Cadence
The flywheel needs a cadence. Without cadence, the system becomes reactive.
Pre-Launch Cadence
Before activation, confirm:
- Source inventory exists.
- Source assets are tagged.
- Clip portfolio logic is defined.
- Creator cohorts are mapped.
- Incentives are clear.
- Governance rules are approved.
- Submission and approval workflow is ready.
- Measurement schema is ready.
- Reallocation authority is defined.
- Reporting cadence is scheduled.
Pre-launch work determines whether the first cycle produces usable learning.
Daily Operating Cadence
During active campaign windows, daily review should focus on operational movement:
- Assets submitted
- Assets approved
- Assets rejected
- Assets published
- Approval latency
- Creator issues
- Compliance issues
- Early velocity signals
- Urgent reallocation opportunities
Daily cadence should not become executive reporting. It exists to keep the loop moving.
Weekly Optimization Cadence
Weekly review should focus on learning and decisions:
- Top-performing source assets
- Top-performing hooks
- Top-performing creator cohorts
- Underperforming creator cohorts
- Platform and surface differences
- Approval and workflow bottlenecks
- Incentive issues
- Reallocation decisions
- Next week’s test plan
The output of weekly review should be a decision log.
Campaign Cycle Retrospective
At the end of a campaign cycle, review:
- Total qualified attention
- Distribution Multiplier
- Creator-powered CPM
- Organic CPM Differential
- Distribution Score
- Momentum Index
- Creator retention
- Reusable assets created
- Learning extracted
- Resource shifts made
- Source content implications
- Governance issues
- Next-cycle priorities
The retrospective should answer one question:
Did this campaign increase future distribution capacity?
If not, the campaign may still have produced value, but it did not strengthen the flywheel.
Quarterly Infrastructure Review
At a higher level, review:
- Creator Capital growth
- Creator density by audience segment
- Content liquidity by source type
- Media liquidity by rights status
- Benchmarks by vertical, creator cohort, and platform
- Operating cost per campaign cycle
- Internal team capacity
- Automation opportunities
- Platform concentration risk
- Governance maturity
- Build-vs-buy implications
The quarterly review connects flywheel performance to the broader Distribution Infrastructure Layer.
Read the whole book
The New Attention Economy: The Distribution Manifesto, 11 chapters, free to read and share.
Related courses
When you are ready to apply it
Ready to launch a campaign?
Use Clipur to turn existing content into distributed short-form reach.